
Introduction
You may have heard that VMware recently acquired a company (and product) called Wavefront. This is essentially an incredibly scalable SaaS-solution for analyzing time-series data with an emphasis on monitoring. With Wavefront, you can ingest north of a million data points per second and visualize then in the matter of seconds. If you haven’t already done so, hop on over to http://wavefront.com/sign-up and set up a trial account! It’s a pretty cool product.
But for a monitoring and analytics tool to be interesting, you need to feed it data. And what better data to feed it than metrics from vRealize Operations? As you may know, I recently released a Fling for bulk exporting vRealize Operations data that you can find here. So why not modify that tool a bit to make it export data to Wavefront?
A quick primer on Wavefront
From a very high level point of view, Wavefront consists of three main components:
- The application itself, hosted in the public cloud.
- A proxy you run locally that’s responsible for sending data to the Wavefront application.
- One or more agents that produce the data and send it to Wavefront.
You may also use an agent framework such as Telegraf to feed data to the proxy. This is very useful when you’re instrumenting your code, for example. Instead of tying yourself directly to the Wavefront proxy, you use the Telegraf API, which has plugins for a wide range of data receivers, among them Wavefront. The allows you to de-couple your instrumentation from the monitoring solution.
In our example, we will communicate directly with the Wavefront proxy. As you will see, this is a very straightforward way of quickly feeding data into Wavefront.
Metric format
To send data to the Wavefront Proxy, we need to adhere to a specific data format. Luckily for us, the format is really simple. Each metric value is represented by a single line in a textual data stream. For example, sending a sample for CPU data would look something like this:
vrops.cpu.demand 2.929333448410034 1505122200 source=vm01.pontus.lab
Let’s walk through the fields!
- The name of the metric (vrops.cpu.demand in our case)
- The value of the metric
- A timestamp in “epoch seconds” (seconds elapsed since 1970-01-01 00:00 UTC)
- A unique, human readable name of the source (a VM name in our case)
That’s really it! (OK, you can specify properties as well, but more about that later)
Pushing the data to Wavefront
Now that we understand the format, let’s discuss how to push the data to Wavefront. If you’re on a UNIX-like system, the easiest way, by far, is to use the netcat (nc) tool to pipe the data to the Wavefront proxy. This command would generate a data point in Wavefront:
echo "vrops.cpu.demand 2.929333448410034 1505122200 source=vm01.pontus.lab" | nc localhost 2878
This assumes that there’s a Wavefront proxy running on port 2878 on localhost.
Putting it together
So now that we know how to get data into Wavefront, let’s discuss how we can use the vRealize Operations Export Tool to take metrics from vRealize Operations to Wavefront. The trick is the newly added output format called – you guessed it – wavefront. We’re assuming you’re already familiar with the vRealize Operations Export Tool definition file (if you’re not, look here). To make it work, we need a definition file with an output type of “wavefront”. This one would export basic VM metrics, for example:
resourceType: VirtualMachine
rollupType: AVG
rollupMinutes: 5
align: 300
outputFormat: wavefront
dateFormat: "yyyy-MM-dd HH:mm:ss"
fields:
# CPU fields
  - alias: vrops.cpu.demand
    metric: cpu|demandPct
  - alias: vrops.cpu.ready
    metric: cpu|readyPct
  - alias: vrops.cpu.costop
    metric: cpu|costopPct
# Memory fields
  - alias: vrops.mem.demand
    metric: mem|guest_demand
  - alias: vrops.mem.swapOut
    metric: mem|swapoutRate_average
  - alias: vrops.mem.swapIn
    metric: mem|swapinRate_average
 # Storage fields
  - alias: vrops.storage.demandKbps
    metric: storage|demandKBps
 # Network fields
  - alias: vrops.net.bytesRx
    metric: net|bytesRx_average
  - alias: vrops.net.bytesTx
    metric: net|bytesTx_average
If we were to run an export using this configuration file, we’d get an output that looks like this:
$ exporttool.sh -H https://host -u user -p secret -d wavefront.yaml -l 24h
vrops.cpu.demand 1.6353332996368408 1505122200 source=ESG-NAT-2-0
vrops.cpu.costop 0.0 1505122200 source=ESG-NAT-2-0
vrops.mem.swapOut 0.0 1505122200 source=ESG-NAT-2-0
vrops.net.bytesTx 0.0 1505122200 source=ESG-NAT-2-0
vrops.host.cpu.demand 15575.7890625 1505122200 source=ESG-NAT-2-0
vrops.mem.swapIn 0.0 1505122200 source=ESG-NAT-2-0
...
The final touch
Being able to print metrics in the Wavefront format to the terminal is fun and all, but we need to get it into Wavefront somehow. This is where netcat (nc) comes in handy again! All we have to do is to pipe the output of the export command to netcat and let the metrics flow into the Wavefront proxy. Assuming we have a proxy listening on port 2878 on localhost, we can just type this:
$ exporttool.sh -H https://host -u user -p secret -d wavefront.yaml -l 24h | nc localhost 2878
Wait for the command to finish, then go to your Wavefront portal and go to “Browse” and “Metrics”. You should see a group of metrics starting with “vrops.” If you don’t see it, give it a few moments and try again. Depending on your load and the capacity you’re entitled to, it may take a while for Wavefront to empty the queue.
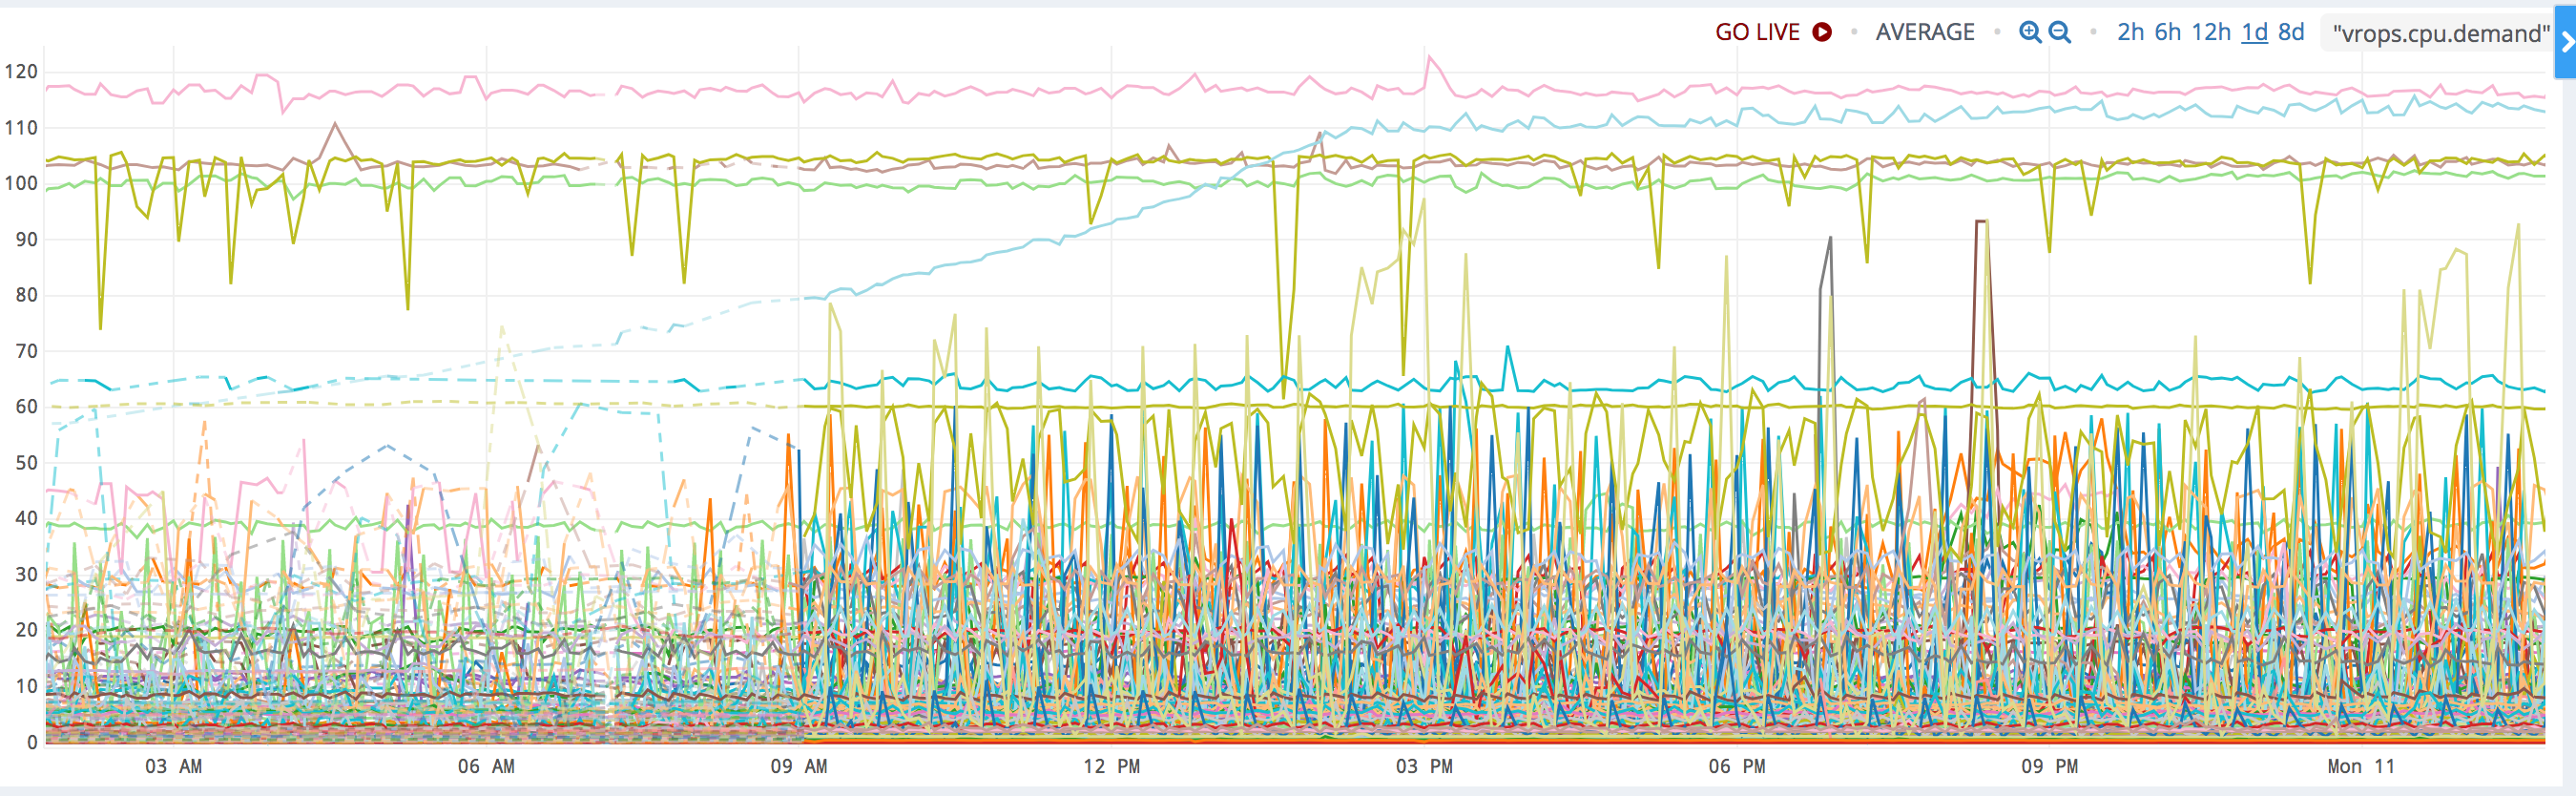
Here’s what a day of data looks like from one of my labs. Now we can start analyzing it! And that’s the topic for another post… Stay tuned!

Pingback: Software Engineers Gush About All the Ways They’re Using Wavefront - Wavefront