vRealize Operations reporting on host profiles

Introduction

After I published my post about importing advanced host properties into vRealize Operations, a colleague told me that it was very nice, but the real kicker would be to somehow import the host profile compliance stature into vRealize Operation. Again, true to his motto “How hard can it be?”, the Viking set out to explore this challenge.

And, yet again, it turned out to be not hard at all. A few lines of Python code did the trick.

What’s a host profile?

Maybe a quick recap of host profiles could be useful. Host profiles were introduced several years ago in vSphere 4.0 and roughly serve three purposes:

  1. Work in conjunction with Auto Deploy to allow “stateless” hosts. These hosts don’t need any configuration at the host level, but read their configuration from a host profile when they boot and applies it on-the-fly.
  2. Report compliance against a host profile, i.e. list all deviations of host settings from the host profile.
  3. Proactively apply a host profile to an existing host to force it into compliance.

Under the hood, a host profile is just a long list of rules describing what the desired settings of a host should be. Host profiles are typically generated from a reference host. You simply select a host you consider correctly configured and vCenter will create all the rules to check and enforce compliance based on that host.

Host profiles and vRealize Operations

I often hear how nice it would be if vRealize Operations could check compliance with host profiles. So often that I decided to give it a try. As you may know, adding new functionality to vRealize Operations is really simple with e.g. Python. Building the host profile functionality required about a 100 lines of code.

Here’s how my script works:

  1. List all the host profiles known to a vCenter.
  2. Trigger a host profile compliance check. This will check the profile against all the hosts it’s attached to.
  3. Scan through the result and send notification events to vRealize Operations for each violation found.
  4. Define a symptom that triggers based on the event and compliance alert based on the symptom.

Running the script

For complete information about installing and running the script, refer to the Github site: https://github.com/prydin/vrops-import-hostprops

However, running the script is simple. Create a config file as described on Github and run this command:

python import-host-profiles.py --config path/to/config/file

If you want the check to run periodically, you should put the script in your crontab on Linux or in a scheduled job on Windows. Checking compliance of a large number of hosts take a while, so you should only run the script one or a couple of times per day.

The result

Once you have imported the alert definition and captured some host profile violations, you should see them under the Analysis->Compliance sub tab. It should look something like below. Of course, you can trigger email notifications or webhook notifications based on the compliance alert.

Screen Shot 2017-12-13 at 2.15.23 PM

Useful links

Code, installation instructions and manual:

https://github.com/prydin/vrops-import-hostprops


Generating Reports from vRealize Operations with Pentaho Reports – Part 1

Background

Although vRealize Operations has a really solid report generator built in, I often get the question how to hook up an external report generator to vRealize Operations. Sometimes users need some piece of functionality not found in the standard report generator and other times they want to bring data from vRealize Operations into an existing corporate reporting framework.

This led me to spend some time experimenting with Pentaho Report Designer and Pentaho Data Integration (also known as Kettle).

This discussion is going to get pretty technical. But don’t worry if you can’t follow along with every step! The transformation and report are available for download at the end of the article!

What is Pentaho and why do I use it?

Pentaho is an analytics and business intelligence suite made up of several products. It was acquired by Hitachi who sells a commercial version of it but also maintains free community version. In this post, we’re using the community version. Although I haven’t tested it with the commercial version, I’m assuming it would work about the same.

For this project, we’re using two components from Pentaho: Kettle (or data integrations) and Pentaho Reports. Kettle is an ETL tool that lets us take data from an arbitrary source and normalize it so it can be consumed by Pentaho Reports.

Getting the data

Typically, report generators are used with data from a SQL database, but since metrics in vRealize Operations reside in a distributed proprietary datastore, this is not a feasible solution. Also, database-oriented solutions are always very sensitive to changes between versions of the database schema and are therefore typically discouraged.

Instead, we are going to use the vRealize Operations REST API to gain access to the data. Unfortunately, Pentaho Reports doesn’t have an native REST client and there’s where Kettle comes in. As you will see, the report works by using a Kettle transformation as a data source.

Goals for this project

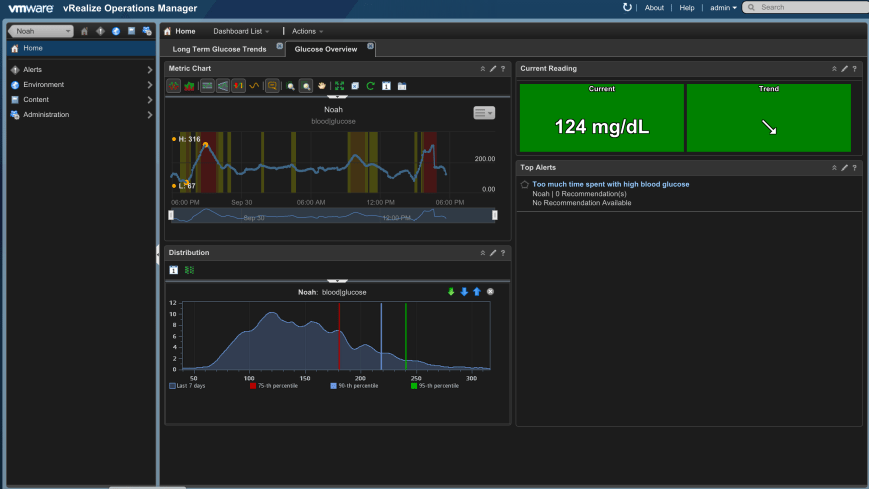
The goal for this project is very simple. We are just going to create a report that shows our VMs and a graph of the CPU utilization for each one of them. In subsequent posts, we are going to explore some more complex reports, but for now, let’s keep it simple. The report is going to look something like this:

screen-shot-2016-10-06-at-4-33-20-pm

Solution overview

DISCLAIMER: I am not a Pentaho expert by any means. In fact, I’ve been learning as I’ve been working on this project. If you know of a better way of doing something, please drop me a note in the comments!

This overview is intended to explain the overall design of the solution and doesn’t go into detail on how to install and run it. See the section “Installing and running” below for a discussion on how to actually make it work.

Kettle Transformation

To produce the data for the report shown above, we need to perform to major tasks: We need to ask vRealize Operation for a list of all eligible VMs and we need to ask it for the CPU demand metric for each one of them.

Kettle principles

Before we get into the design, it’s necessary to understand how Kettle operates. The main unit of work for Kettle is a rowset. This is essentially a grid-like data structure resembling a table in a SQL database. As the rowset travels through a transformation pipeline, we can add and remove columns and rows using various transformation steps.

Our Kettle Transformation

Transformations in Kettle are built using a graphical tool called “spoon” (yes, there’s a kitchen utensil theme going on here). Transformations are depicted as pipelines with each step performing some kind of operation on the rowset. This is what our transformation pipeline looks like. Let’s break it down step by step!

screen-shot-2016-10-06-at-4-51-07-pm

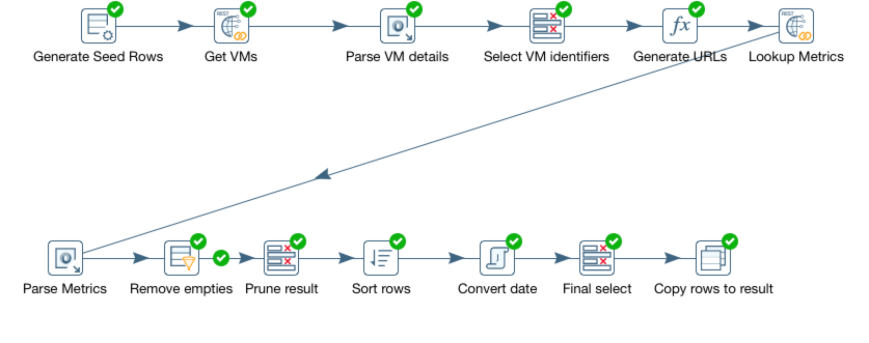
  1. Generate seed rows. Kettle needs a rowset to be able to perform any work, so to get the process started, we generate a “seed” rowset. In this case, we simply generate a single row containing the REST URL we need to hit to get a list of virtual machines.
  2. Get VMs. This step carries out the actual REST call to vRealize Operations and returns a single string containing the JSon payload returned from the rest call.
  3. Parse VM details. Here we parse the JSon and pull out information such as name and ID of the VM.s
  4. Select VM identifiers. This is just a pruning step. Instead of keeping the JSon payload and all the surrounding data around, we select only the name and the ID of each VM.
  5. Generate URLs. Now we generate a list of REST URLs we need to hit to get the metrics.
  6. Lookup Metrics. This is the second REST call to vRealize Operations. This is executed for each VM identified and will look up the last 24 hours of CPU demand metrics and return it as a JSon string.
  7. Parse Metrics. Again, we need to parse the JSon and pull out the actual metric values and their timestamps. This is actually akin to a cartesian product join in a database. The rowset is extended by adding one row per VM and metric sample. Thus, the number of rows is greatly increased in this step.
  8. Remove empties. Some VMs may not have any valid metrics for the last 24 hours. This step removes all rows without valid metrics.
  9. Sort rows. Sorts the rows based on VM name and timestamp for the metric.
  10. Convert date. Dates are returned from vRealize Operations as milliseconds since 01/01/1970. This step converts them to Date objects.
  11. Final select. Final pruning of the dataset, removing the raw timestamp and some other fields that are not needed by the report.
  12. Copy rows to result. Finally, we tell the transformation to return the rowset to the caller.

Lots of steps, but they should be fairly easy to follow. Although Kettle carries a bit of a learning curve, it’s a really powerful tool for data integration and transformation.

The result of our transformation will be a set of rows containing the name of the VM, a timestamp and a metric reading. Each VM will have 24 hours worth of metric readings and timestamps similar to this example:

Screen Shot 2016-10-06 at 5.00.51 PM.png

Our Pentaho Report

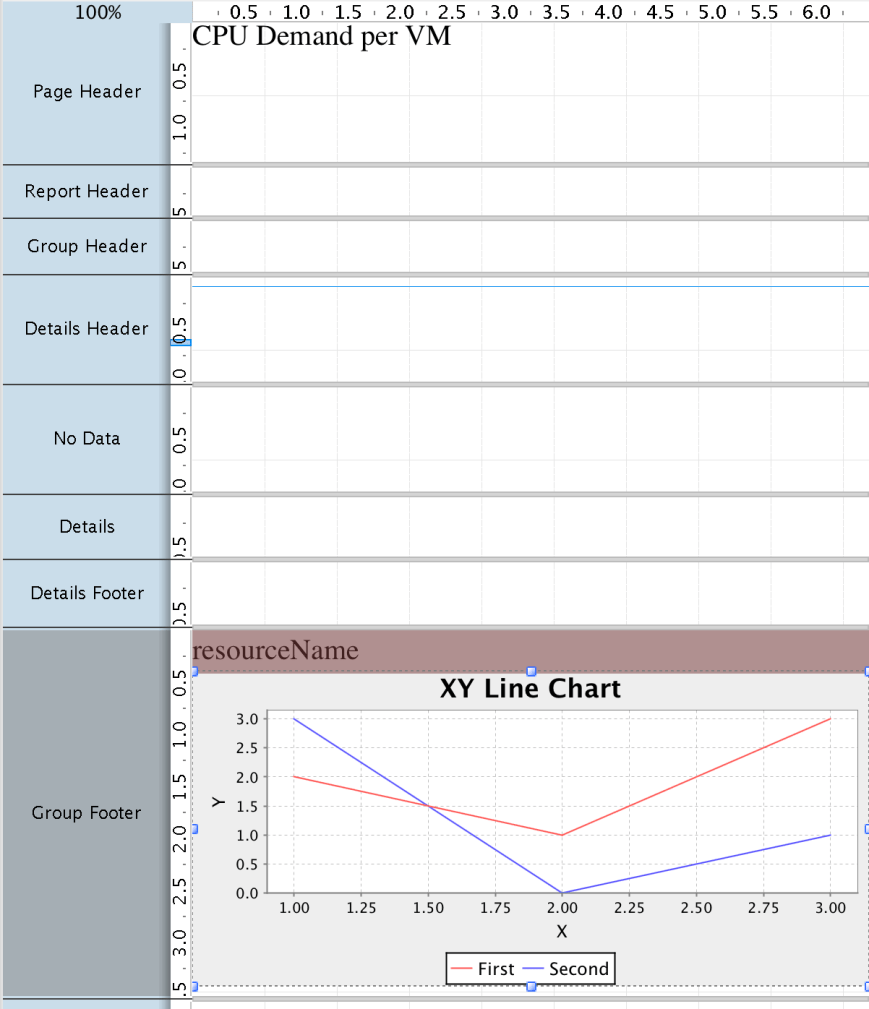
At this point, we have a nice data stream with one entry per sample, along with a resource name and a timestamp. Time to build a report! To do that, we use the graphical Pentaho Report Designer tool. Our report will look something like this in the designer:

screen-shot-2016-10-06-at-5-07-05-pm

Grouping the data

We could, of course, just put the data stream in the details section of a report and be done with it, but it wouldn’t make a very interesting report. All it would do is to list a long litany of samples for all the resources we’ve selected. So obviously, some kind of grouping is needed.

We solve this by inserting a, you guessed it, Group object into the report. A group object allows us to group the data based on some field or condition. In our case, we’ll group it by the “resourceName” (the name of the VM). Thus, we’ll have one group per VM.

Adding the graph

Now we can add the graph. But where do we add it? Let’s examine the sections in the screen shot above. There are couple of things to take notice of. First, anything we put in the Details section gets repeated for every row in the dataset. So if we put the graph there, we’d get thousands of graphs each showing a single datapoint. Clearly not what we want.

So what about the group? How can we put our graph at a group level? That’s where the group header and footer come into play. These are intended for summaries of a group. And since we want to summarize all the samples for a VM (which is the grouping object), that seems like a good place. Most tutorials seem to recommend using the group footer.

Configuring the graph

Once we’ve added the graph, we need to configure it. This is done simply by double clicking on it. First we select the graph type. For a time series this has to be set to “XY line graph”.

Once we’ve done that, we can start configuring the details. Here’s what it looks like:

screen-shot-2016-10-06-at-5-07-26-pm

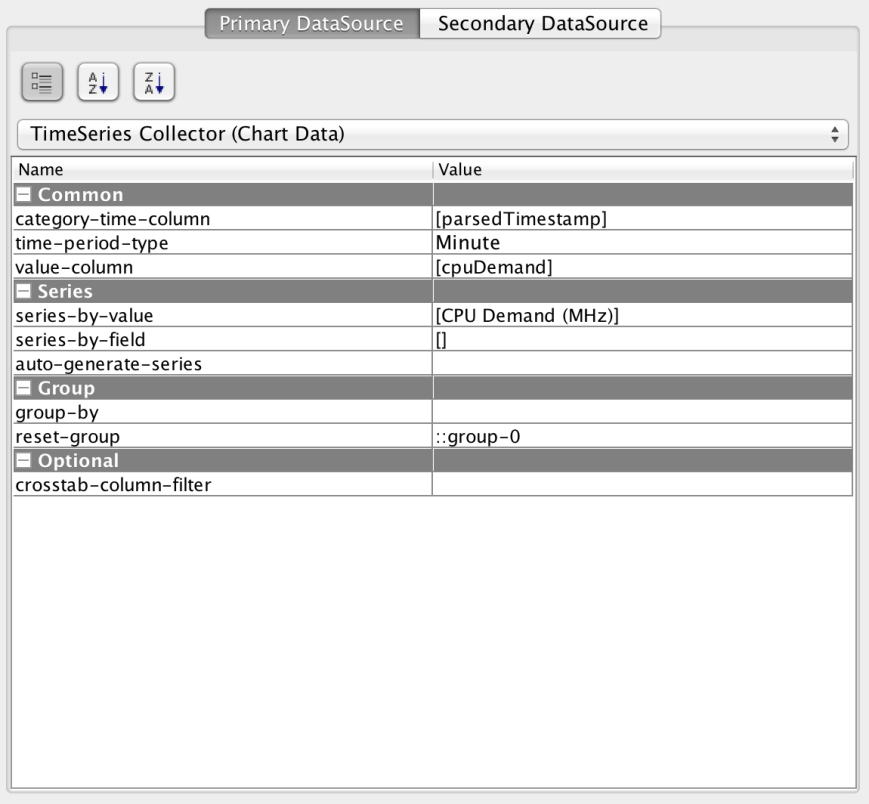
First, we need to select the TimeSeries Collector. This causes the data to be handled as a time series, rather than generic X/Y coordinates. Then we pick the “category-time-column” and set it to our timestamp field and set the “value-column” to “cpuDemand”.

Next, we edit the “series-by-value” to provide a graph legend.

Finally, we set the “reset-group” field to “::group-0”. This resets the data collection after every group, preventing data from being accumulated.

Parameters

Finally, we need some way of keeping track of variables like the hostname, username and password for the vRealize Operations instance we’re working with. This is done through parameters of the transformation that are exposed as report parameters. We can provide defaults values and even hide them from the user if we are always using the same instance and user. See below for a discussion on the parameters!

Installing and running

So far, it’s been a lot of talk about the theory of operation and the design. Let’s discuss how to install and run the report!

Installing Pentaho Reporting

  1. Download the Pentaho Reporting Designer from here.
  2. Unzip the file and go to the directory where you installed the software.
  3. Run it with report-designer.sh on Linux/OSX or report-designer.bat on Windows.

Allowing use of self-signed certs

If your certificate for vRealize Operations is signed by a well-known authority, you should be good to go. If not, you need to perform these two steps.

On windows

Edit the file report-designer.bat. Insert the java parameter “-Djsse.enableSNIExtension=false” on the last line. The line should look like this:

start “Pentaho Report Designer” “%_PENTAHO_JAVA%” -Djsse.enableSNIExtension=false -XX:MaxPermSize=256m -Xmx512M -jar “%~dp0launcher.jar” %*

On Linux/OSX

Edit the file report-designer.bat. Insert the java parameter “-Djsse.enableSNIExtension=false” on the last line. The line should look like this:

“$_PENTAHO_JAVA”-Djsse.enableSNIExtension=false -XX:MaxPermSize=512m -jar “$DIR/launcher.jar” $@

Finally, you will have to add the certificate from vRealize Operations to your java certificate store. This can be done by downloading your cert from your browser (typically by clicking the lock symbol next to the URL field) and following these instructions.

Installing Pentaho Data Integration (Kettle)

This step is optional and needed only if you want to view/modify the data transformation pipeline.

  1. Download Pentaho Data Integration from here.
  2. Unzip the file and go to the directory where you installed the software.
  3. Run it with spoon.sh on Linux/OSX or spoon.bat on Windows.

Allowing use of self-signed certs

If your certificate for vRealize Operations is signed by a well-known authority, you should be good to go. If not, you need to perform these two steps.

On Windows

Edit the file spoon.bat and insert the following line right before the section that says “Run” inside a box of stars:

On Linux/OSX

Edit the file spoon.sh and insert the following line right before the section that says “Run” inside a box of stars:

OPT=”%OPT% -Djsse.enableSNIExtension=false”
REM ***************
REM ** Run…    **
REM ***************

Finally, you will have to add the certificate from vRealize Operations to your java certificate store. This can be done by downloading your cert from your browser (typically by clicking the lock symbol next to the URL field) and following these instructions.

Running the report

  1. Start the report designer.
  2. Select File->Open and load the CPUDemand.prpt file.
  3. Click the “Run” icon.
  4. Select PDF.
  5. Fill in the host, username and password for vR Ops.
  6. Click OK.

Next steps

The purpose of this project was to show the some of the techniques used for running a report generating tool against vRealize Operations. Arguably, the report we created isn’t of much value. For example, it will only pick the 100 first VMs in alphabetical order and it’s rather slow. For this to be useful, you would want to pick VMs based 0n some better criteria, such as group membership or VMs belonging to a host or cluster.

We will explore this and other techniques in an upcoming installment of this series when we are building a more useful “VM dashboard” report. Stay tuned!

Downloadable content

The data transformations and report definitions for this project can be downloaded here.

A Simple Template for vR Ops Python Agents

Background

Since I wrote the post about vraidmon, I’ve gotten some requests for a more generic framework. Although what I’m describing here isn’t so much a framework as a simple template, some may find it useful. You can find it here.

What does it do?

In a nutshell, this template helps you with three things:

  1. Parsing a config file
  2. Simplifying metric and properties posting
  3. Simplifying management of parent-child relationships.

The config file

The template takes the name of a configuration file as its single argument. The file contains a list of simple name/value pairs. Here is an example:

vropshost=vrops-01.rydin.nu
vropsuser=admin
vropspassword=secret
adapterSpecific1=bla
adapterSpecific2=blabla

The vropshost, vropsuser and vropspassword are mandatory and specify the host address, username and password for connecting to vR Ops. In addition to this, adapter specific configuration items can be specified.

Writing the adapter

Screen Shot 2015-12-22 at 3.51.03 PM

Using this template is very easy. Just locate the “YOUR CODE GOES HERE” marker and start coding! The only requirement is that you have to set the adapterKind and adapterName variables.

Setting the adapter type and name

The adapterKind is the “adapter kind key” for the adapter you’re building. It basically tells the system what kind of adapter you are. You can really put anything in here, but it should be descriptive to the adapter type, such as “SAPAdapter” or “CISCORouterAdapter”.

The “adapterName” is a name of this particular instance of the adapter. There could very well be multiple adapters of the same type, so a unique name is needed to tell them apart.

Posting data

Once we’ve got the adapter naming out of the way, we can start posting data. This is done through the “sendData” function. It takes 5 parameters:

  1. The vR Ops connection we’re using
  2. The resource type we’re posting for. This should uniquely specify what kind of object the data is for. E.g. “CISCORouterPort” if we’re posting data about a port.
  3. Resource name. This uniquely identities the object we’re posting data for, e.g. “port-4711”.
  4. A name-value pair list of metrics we’re posting for the resource, e.g. { “throughput”: 1234, “errors”: 55 }
  5. A name-value pair list of properties we’re posting e.g. { “state”: “functional”, “vendor”: “VMware” }

The sendData function returns the resource we posted data for. Note that if the resource didn’t already exist, it will be created for you.

Building relationships

Sometimes you want your monitored resources to be connected to some parent object. For example, if you are monitoring tables in a database, you may want them to be children of a database object. This way, they will show up correctly in dependency graphs in vR Ops and your users will find it easier to navigate to them.

To form a parent-child relationship, use the addChild function. It takes the following parameters:

  1. The vR Ops connection to use
  2. The adapter kind of the parent object
  3. The adapter name of the parent object
  4. The resource kind of the parent object
  5. The resource name of the adapter object
  6. The child resource to add
  7. (Optional) A flag determining whether parent objects should be automatically created if they don’t exist. By default, they are not automatically created and adding a child results in a no-op.

Here’s an example of an agent using this template that monitors Linux processes. As you can see, we’ve used the “addChild” function to add the Linux process objects to a Linux host.

Screen Shot 2015-12-22 at 4.10.51 PM.png

Downloadable content

Github repository: https://github.com/prydin/vrops-py-template

vraidmon – A vRealize Operations Adapter Written in Python

Background

Two events coincided today: Realizing that I’ve been running without redundancy on a Linux software RAID coincided with me having some time to spare for a change. So I decided to write a simple vR Ops agent to monitor a software RAID, and, since I had some time on my hands, I wanted in Python instead of my go-to language Java. This is my very first Python program, so bear with me.

Learning Python proved to be very easy. It’s a very intuitive language. I’ve got some issues with loosely typed languages, but for a quick hack I’m willing to put that aside. What turned out to be a bit more difficult was to find any good examples of agents for vR Ops written in Python. The blog vRandom had a getting started guide that allowed me to understand how to install and get the thing running, but how to code the actual agent was harder to find. But after some trial and error I got the hang of it and I decided to share my experience here.

A quick look at the code

Initializing

The client library is called “nagini”, so before we can do anything, we need to import it:

import nagini

Next, we need to obtain a connection to vR Ops. This is done like this:

vrops = nagini.Nagini(host=vropshost, user_pass=(vropsuser, 
vropspassword))

It’s worth noticing that this doesn’t actually make the connection. It just sets up the connection parameters. So if you do something wrong, like mistyping the password, this code will gladly execute but you’ll get an error later on when you’re trying to use the connection.

Sending the data

Here is where things get quite interesting and the Python client libraries show their strength. While all the REST methods are exposed to the programmer, the libraries also add some nice convenience methods.

Normally, when you post metrics for a resource, you need to do it in three steps:

  1. Look up the resource to obtain its ID.
  2. If the resource doesn’t exist, create it.
  3. Send the metrics using the resource ID you just obtained by looking it up or creating it.

The vR Ops Python client can do this in a single call! All we have to do is to put together somewhat elaborate data structure and send it off. Let’s have a look!

Screen Shot 2015-12-15 at 9.21.09 AM

Wow, that’s a lot of code! But don’t despair! Let’s break it down. In this example, I’m sending but stats and properties. If you recall, stats are numeric values, such as memory utilization and remaining disk space, whereas properties are strings and typically more static in nature. Let’s examine the stats structure.

The REST API states that stats should be sent as a single member called “stat-content”. That member contains an array of sub-structures, each representing a sample. Each sample has a “statKey” holding the name of the metric, a “timestamp” member and a “data” member holding the actual data value. As you can see above, I’m sending three values, the “totalMembers”, “healthyMenbers” and “percentHealthy”.

Now that we have our fancy structure, we can send it off using the find_create_resource_push_data method. It does exactly what the name implies: It tries to find the resource, if it doesn’t it creates it and then it pushes the data. To make it woek, we need to send the name of the resource, the name of the resource kind as well as adapter kind and the stats and/or properties. And that’s it! We’ve now built an adapter with Python using a single call to the vR Ops API!

What about the timestamp?

But wait, there’s one more thing we need to know. The vR Ops API expects us to send a timestamp as a Java-style epoc milliseconds long integer. How do we obtain one of those in Python.

Easy! We just time.time() method (you have to import “time” first). This gives us the epoc seconds (as opposed to milliseconds) as a float, so we have to multiply it by 1000 and convert it to a long. It will look something like this:

timestamp = long(time.time() * 1000)

Installing and running

Prerequisites

First of all, you need to install python (obviously). Most likely it’s already installed, but if it isn’t, just go to the package manager on your system and install it. Next, you need the client libraries for vR Ops. They are located on your vR Ops server and can be downloaded and installed like this:

mkdir tmp
cd tmp
wget --no-check-certificate https://<your vrops server>/suite-api/docs/bindings/python/vcops-python.zip
unzip vcops-python.zip
python setup.py install

Installing the agent

Download the agent from here. Unzip it in the directory where you want to run it, e.g. /opt/vraidmon

mkdir /opt/vraidmon
unzip <path to my zip>

Next, we need to edit the configuration file vraidmon.cfg. You need to provide hostname and login details for your vR Ops. The name of the raid status file should remain /proc/mdstat unless you have some very exotic version of Linux. Here is an example:

vropshost=myvrops.mydomain.com
vropsuser=admin
vropspassword=topsecret!
mdstat=/proc/mdstat

Now you can run the agent using this command:

python vraidmon.py vraidmon.cfg

You’ll probably get some warning messages about certificates not being trusted, but we can safely ignore those for now.

Making it automatic

Running the agent manually just sends a single sample. We need some way of making this run periodically and the simplest way of doing that is through a cron job. I simply added this to my crontab (ignore any line breaks and paste it in as a single line):

*/5 * * * * /usr/bin/python /opt/vraidmon/vraidmon.py /opt/vraidmon/vraidmon.cfg 2> /dev/null

Adding alerts

In order for this adapter to be useful, I added a simple alert that fires when the percentage of healthy members drops below 100%. This is what a simulated failure looks like:

Screen Shot 2015-12-15 at 11.30.49 AM.png

Downloadable material

Python source code and sample config file.

Alert and symptom definition.


Glucose Monitoring – A vRealize Operations Adapter using the SDK

Background

I have close friend who is unfortunate enough to suffer from Type 1 Diabetes. As you may know, this deadly disease can only be managed by constantly monitoring your blood glucose and injecting insulin. Fortunately, there’s a silver lining and it’s called “cool gadgets”. Many diabetes sufferers are now wearing continuous glucose monitors, which electronically monitor the patient’s glucose level and displays the numbers and trends.

But it doesn’t stop there. The Dexcom glucose monitor allows the metrics to be sent to the cloud in real time for remote monitoring an analysis. Of course it didn’t take long before some geeky diabetics figured out how to harvest the data and build open-source tools around it. They founded the Nightscout Foundation and continue to build useful and life-saving tools for managing diabetes on an open-source basis. You should check them out! They do amazing work!

When I heard about this, I was thinking that this is just time series data with trends and patterns that’s accessible through a simple REST-API. Then I thought of vR Ops, which is a tool that can analyze such data and I figured it would be fun to write an adapter that pulls in blood glucose data into vR Ops. So the next time I had a break between two meetings, I went to work!

The most interesting thing about this project is, in my opinion, how it leverages the dynamic thresholds to determine the normal range for blood glucose levels over the course of a day. It serves as a great demo of how the algorithms in vRealize Operations can adapt to virtually anything!

graph

vRealize Operations Java API

Since I have a background as a Java developer, I realized that using the Java API for vRealize Operations would be the easiest way to go. The Java API is essentially a wrapper around the REST API that allows you to interact with vRealize Operations through regular Java classes. If you are a Java programmer and want to interact with vRealize Operations, this is the way to go!

The Nightscout API

This API is dead simple. All you have to do is to issue a GET against http://{host}/api/v1/entries/current to get the latest sample. The sample is then returned as a tab-separated string containing timestamp, glucose reading and a trend indicator. For this project, we’re just using the timestamp and the glucose reading.

Running the code

We could have created some kind of intelligent scheduler trying to synchronize data collection with the timestamps of returned data to minimize lag, but in this case, I just went with a simple Java program that’s kicked off by a cron-job set to execute every five minutes.

The Java program takes the following parameters: A username and password for vRealize Operations, a URL for Nightscout and the name of the patient we’re collecting data for.

A walkthrough of the code

The run() method

The code is fairly simple, but it illustrates a few key concepts of the Java API for vRealize Operations. The bulk of the work happens in the run() method.

Screen Shot 2015-07-10 at 3.41.18 PM

This function is called once the parameters are extracted and parsed. First, it opens an HTTP connection to Nightscout and issues a GET. The result is then parsed, simply by splitting up the comma-separated string.

Once that’s done, we call vRealize Operations to look up an object representing the patient we’re monitoring. We do that by looking up an object of the type “Human” with the patient name supplied on the command like. If we don’t find the patient record, we create it.

Finally, we pack the data samples into an array and call “addStats” to send the new sample to vR Ops.

The findResourceByName() method

This method is really just a wrapper around the API call for looking up an object by name.

Screen Shot 2015-07-10 at 3.48.38 PM

The first three lines deal with the resource type. When this is first executed, the resource type “Human” isn’t going to exist so we have to create it.

Once we have the resource kind identifier, we can go ahead and call the “getResources” API method. This will return a list of resource identifiers, but since we know there should only be one, we can return the first (and only) object we find.

The createHuman() method

If the object representing the patient doesn’t exist, we need to create it.

Screen Shot 2015-07-10 at 3.52.33 PM

Again, this is just a prettier version of the API method for creating a resource. All it does is to fill out a structure with the resource kind identifiers, adapter kind and adapter name. The “resourceKey” is the unique identifier for this object and in our case consists of the patient name.

The addStats() method

This method performs the final task of actually sending the metrics to vRealize Operations.

Screen Shot 2015-07-10 at 3.56.06 PM


As usual, this method does little more than just assembling a structure containing the necessary values for the API call. Notice that we could send multiple timestamps and values if we wanted. In this case, however, we’re just dealing with the latest value from Nightscout, so we’re only supplying a single timestamp and value.

The end result

Screen Shot 2015-07-10 at 4.02.39 PM

The end result is actually quite fascinating and a great testament to the dynamic thresholds in vRealize Operations. Most people experience a spike in blood glucose level after a meal and a lower blood glucose level during the night. For a person with diabetes, these swings are typically more pronounced. If you look at the dynamic thresholds, you’ll see a lower and more narrow range during the night. After lunch and dinner, the range is wider and spikes are more common. This is clearly visible from the dynamic thresholds (the gray area) behind the graph.

This particular person usually has a low-carb breakfast, so you don’t normally see a spike. However, this day, he had pancakes for breakfast and the blood glucose spiked significantly outside out the normal range. How is that for a demonstration of the dynamic threshold feature in vRealize Operations?

Dashboards

No metric collector is complete without some great dashboards. Here are some examples of dashboards we built for the glucose data.

real-time

Real time view

long-term

Long term view

Conclusion

Although this is a somewhat exotic example of API use, it clearly illustrates the simplicity of use and the power of the automatically calculated dynamic thresholds.

Please consider supporting the research for a cure to Type 1 diabetes. JDRF is an excellent organization to support!

http://jdrf.org/get-involved/ways-to-donate/

The Nightscout Foundation also could use your donation to further promote and develop the open source technology for helping diabetics.

http://www.nightscoutfoundation.org/product/donate-2/

Downloads

The complete source code can be downloaded here.

Source code

Disclaimer

This project is intended as an example of what is possible using glucose monitoring technology and vRealize Operations. It is NOT intended to diagnose or cure any disease or condition. Type 1 Diabetes is a serious condition and should ONLY be managed using methods approved by the appropriate government bodies and recommended by your healthcare professional!