
Background
I have close friend who is unfortunate enough to suffer from Type 1 Diabetes. As you may know, this deadly disease can only be managed by constantly monitoring your blood glucose and injecting insulin. Fortunately, there’s a silver lining and it’s called “cool gadgets”. Many diabetes sufferers are now wearing continuous glucose monitors, which electronically monitor the patient’s glucose level and displays the numbers and trends.
But it doesn’t stop there. The Dexcom glucose monitor allows the metrics to be sent to the cloud in real time for remote monitoring an analysis. Of course it didn’t take long before some geeky diabetics figured out how to harvest the data and build open-source tools around it. They founded the Nightscout Foundation and continue to build useful and life-saving tools for managing diabetes on an open-source basis. You should check them out! They do amazing work!
When I heard about this, I was thinking that this is just time series data with trends and patterns that’s accessible through a simple REST-API. Then I thought of vR Ops, which is a tool that can analyze such data and I figured it would be fun to write an adapter that pulls in blood glucose data into vR Ops. So the next time I had a break between two meetings, I went to work!
The most interesting thing about this project is, in my opinion, how it leverages the dynamic thresholds to determine the normal range for blood glucose levels over the course of a day. It serves as a great demo of how the algorithms in vRealize Operations can adapt to virtually anything!
vRealize Operations Java API
Since I have a background as a Java developer, I realized that using the Java API for vRealize Operations would be the easiest way to go. The Java API is essentially a wrapper around the REST API that allows you to interact with vRealize Operations through regular Java classes. If you are a Java programmer and want to interact with vRealize Operations, this is the way to go!
The Nightscout API
This API is dead simple. All you have to do is to issue a GET against http://{host}/api/v1/entries/current to get the latest sample. The sample is then returned as a tab-separated string containing timestamp, glucose reading and a trend indicator. For this project, we’re just using the timestamp and the glucose reading.
Running the code
We could have created some kind of intelligent scheduler trying to synchronize data collection with the timestamps of returned data to minimize lag, but in this case, I just went with a simple Java program that’s kicked off by a cron-job set to execute every five minutes.
The Java program takes the following parameters: A username and password for vRealize Operations, a URL for Nightscout and the name of the patient we’re collecting data for.
A walkthrough of the code
The run() method
The code is fairly simple, but it illustrates a few key concepts of the Java API for vRealize Operations. The bulk of the work happens in the run() method.
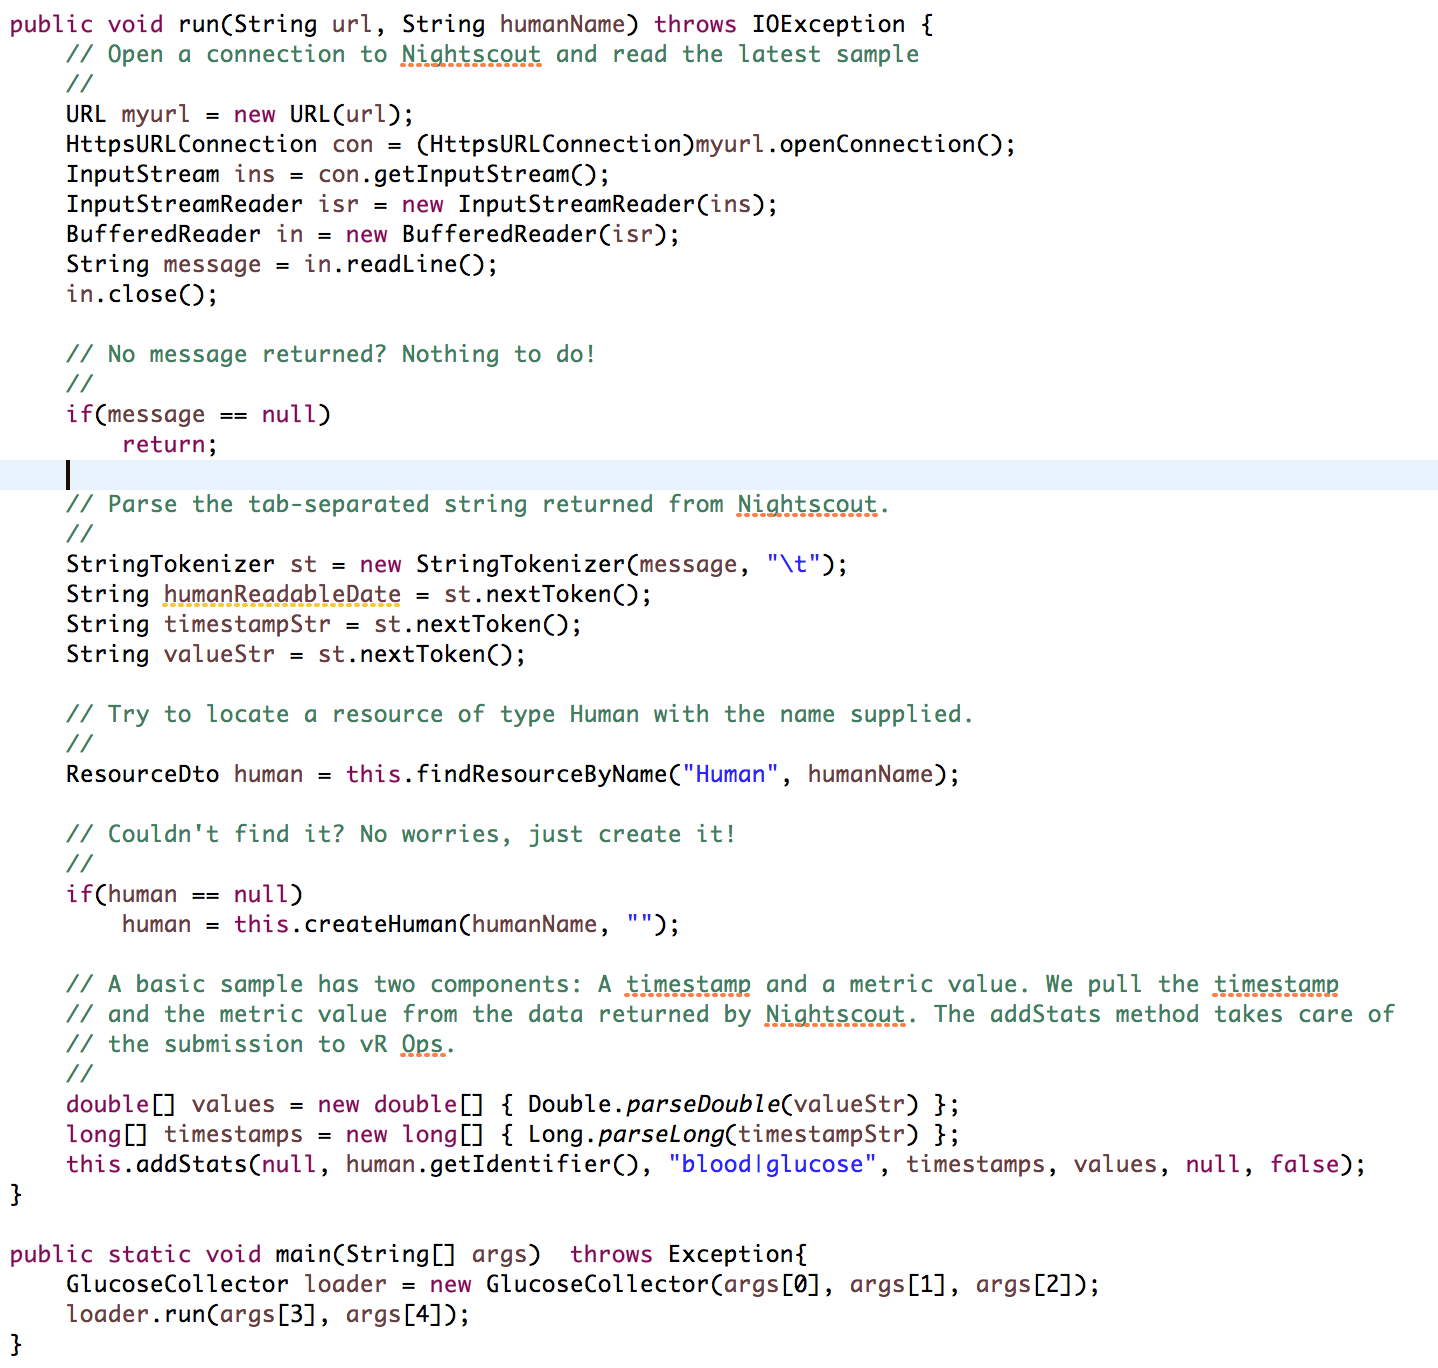
This function is called once the parameters are extracted and parsed. First, it opens an HTTP connection to Nightscout and issues a GET. The result is then parsed, simply by splitting up the comma-separated string.
Once that’s done, we call vRealize Operations to look up an object representing the patient we’re monitoring. We do that by looking up an object of the type “Human” with the patient name supplied on the command like. If we don’t find the patient record, we create it.
Finally, we pack the data samples into an array and call “addStats” to send the new sample to vR Ops.
The findResourceByName() method
This method is really just a wrapper around the API call for looking up an object by name.

The first three lines deal with the resource type. When this is first executed, the resource type “Human” isn’t going to exist so we have to create it.
Once we have the resource kind identifier, we can go ahead and call the “getResources” API method. This will return a list of resource identifiers, but since we know there should only be one, we can return the first (and only) object we find.
The createHuman() method
If the object representing the patient doesn’t exist, we need to create it.

Again, this is just a prettier version of the API method for creating a resource. All it does is to fill out a structure with the resource kind identifiers, adapter kind and adapter name. The “resourceKey” is the unique identifier for this object and in our case consists of the patient name.
The addStats() method
This method performs the final task of actually sending the metrics to vRealize Operations.

As usual, this method does little more than just assembling a structure containing the necessary values for the API call. Notice that we could send multiple timestamps and values if we wanted. In this case, however, we’re just dealing with the latest value from Nightscout, so we’re only supplying a single timestamp and value.
The end result

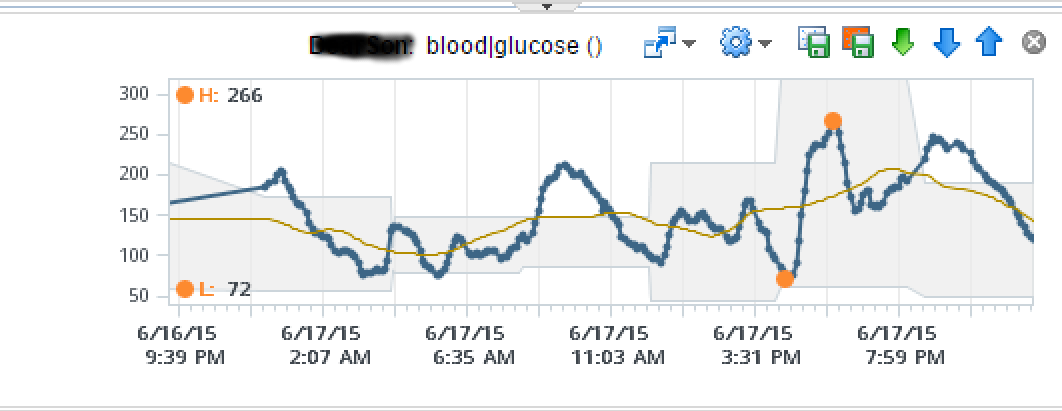
The end result is actually quite fascinating and a great testament to the dynamic thresholds in vRealize Operations. Most people experience a spike in blood glucose level after a meal and a lower blood glucose level during the night. For a person with diabetes, these swings are typically more pronounced. If you look at the dynamic thresholds, you’ll see a lower and more narrow range during the night. After lunch and dinner, the range is wider and spikes are more common. This is clearly visible from the dynamic thresholds (the gray area) behind the graph.
This particular person usually has a low-carb breakfast, so you don’t normally see a spike. However, this day, he had pancakes for breakfast and the blood glucose spiked significantly outside out the normal range. How is that for a demonstration of the dynamic threshold feature in vRealize Operations?
Dashboards
No metric collector is complete without some great dashboards. Here are some examples of dashboards we built for the glucose data.
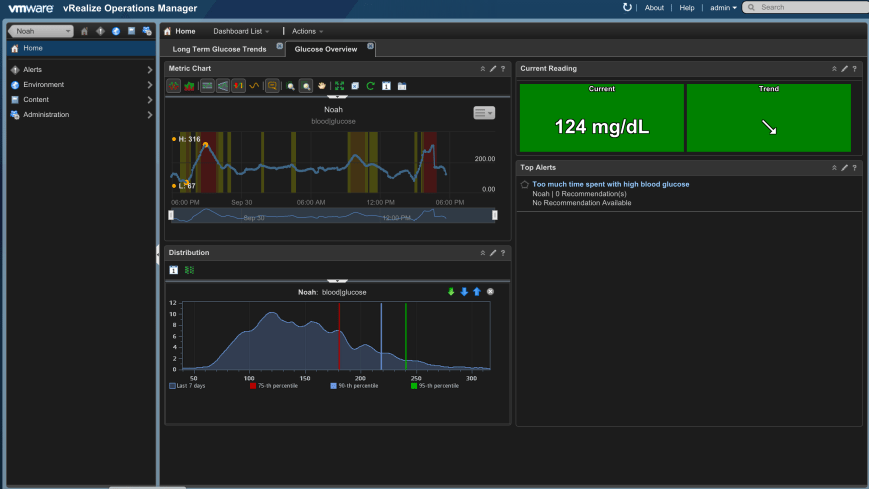
Real time view

Long term view
Conclusion
Although this is a somewhat exotic example of API use, it clearly illustrates the simplicity of use and the power of the automatically calculated dynamic thresholds.
Please consider supporting the research for a cure to Type 1 diabetes. JDRF is an excellent organization to support!
http://jdrf.org/get-involved/ways-to-donate/
The Nightscout Foundation also could use your donation to further promote and develop the open source technology for helping diabetics.
http://www.nightscoutfoundation.org/product/donate-2/
Downloads
The complete source code can be downloaded here.
Disclaimer
This project is intended as an example of what is possible using glucose monitoring technology and vRealize Operations. It is NOT intended to diagnose or cure any disease or condition. Type 1 Diabetes is a serious condition and should ONLY be managed using methods approved by the appropriate government bodies and recommended by your healthcare professional!
